Commentaries
Your Present Location: Teacher_Home> Wang Wen> CommentariesBeyond Bricks and Mortar: How CEO digital vision in smart cities impacts tourism resilience and digital heritage preservation
Beyond Bricks and Mortar: How CEO digital vision in smart cities impacts tourism resilience and digital heritage preservation
Source: Sage
By Meng-Chen Zhang, Hongru Zhang, Ying Wei and Wen Wang
Published: Nov 19, 2025
Abstract
This study investigates the causal impact of CEO digital vision within smart cities on tourism enterprises’ resilience and digital heritage preservation. Employing a Difference-in-Differences quasi-experimental design, we find that firms led by digitally visionary CEOs in smart cities experience significantly greater increases in revenue stability and faster recovery times, alongside enhanced digital heritage digitization and engagement. Heterogeneity analysis reveals these effects are more pronounced for larger firms. Furthermore, increased investment in digital infrastructure partially mediates this relationship, highlighting a key mechanism. Our findings highlight the critical role of strategic digital leadership in fostering robust and culturally engaged tourism sectors within evolving urban digital ecosystems, offering vital theoretical and practical implications for leaders and policymakers.
Keywords
CEO digital vision, smart cities, tourism resilience, digital heritage preservation, difference-in- differences, digital transformation
Introduction
The global landscape is undergoing an unprecedented digital transformation, reshaping industries, economies, and societies at an accelerating pace. Digital transformation operates at multiple levels: at the firm level, where companies digitize processes and customer interfaces; at the industry level, where value chains and competitive dynamics are reorganized; and atthe societal level, where digital technologies restructure patterns of mobility, communication, and governance. This paper focuses on firm-level digital transformation within tourism enterprises, while situating these changes within the broader smart city context. Urban centers are increasingly embracing the ‘smart city ’ ethos, leveraging technological innovation to enhance living, optimize resources, and foster sustainable development (Alakoum and Nica, 2024). Concurrently, the tourism sector navigates immense opportunities from digitalization alongside profound challenges from global uncertainties (Bibri, 2019). Within this dynamic environment, the strategic foresight and leadership of corporate ex- ecutives, particularly their ‘digital vision ’, emerge as pivotal determinants of whether firms can overcome barriers to digital adoption, such as limited resources, skills shortages, or organizational inertia, and thereby succeed in capitalizing on smart city opportunities. Situating this within organizational change and transformation theories, we conceptualize digital vision as a leadership capacity that enables firms to reconfigure resources and realign structures under uncertainty. Moreover, resilience and heritage preservation in digital contexts must also account for cybersecurity risks, including data breaches, system disruptions, and digital asset protection that threaten both operational continuity and the safeguarding of cultural resources. This paper investigates the intricate interplay between a CEO ’s digital vision, smart city initiatives, and their subsequent impact on two critical outcomes for tourism enterprises: tourism resilience and digital heritage preservation.
The smart city concept, once futuristic, has rapidly materialized globally, characterized by pervasive integration of information and communication technologies (ICTs), Internet of Things (IoT) devices, big data analytics, and artificial intelligence to create intelligent ecosystems (Barufi and Kourtit, 2015). His evolution has profoundly reshaped tourism, giving rise to ‘smart tourism ’ which enhances visitor experience, optimizes destination management, and promotes sustainable practices through technology (Argyroudis et al., 2022; Hu et al., 2025; Muniz et al., 2021). However, the mere presence of smart city infrastructure does not automatically translate into firm-level benefits. The transfer of urban digital resources, such as IoT systems, open data platforms, and municipal tourism initiatives, requires firms to develop internal absorptive capacity. This transfer occurs through mechanisms including public—private data sharing, collaborative heritage projects, and the integration of city platforms into firm-level operations. Whether firms succeed in these processes depends heavily on their leadership. A CEO with a strong digital vision not only recognizes the potential of city-wide resources but also mobilizes investments, partnerships, and organizational change to internalize them.
In the meantime, the tourism industry faces increasing vulnerability to shocks, highlighting the imperative of resilience (Fan et al., 2025; Zhang et al., 2024). Traditionally defined in financial or operational terms, resilience now hinges on digital capabilities that enable rapid reconfiguration, diversification of channels, and recovery after crises. Yet, such capabilities often manifest with a temporal delay: for instance, investment in digital infrastructure may only yield observable stability several quarters after implementation. Heritage preservation initiatives display similar lags, as projects such as digitization or virtual reconstructions often require multi-year commitments before generating measurable engagement. These lagged effects are essential for interpreting outcomes and underscore the role of sustained strategic vision (Fan et al., 2025; Mendoza et al., 2023; Wu et al., 2025).
Importantly, engagement outcomes diverge along two dimensions. Commercial engagement reflects the monetization of digital heritage and its contribution to revenue streams, whereas preservation engagement reflects cultural stewardship and long-term safeguarding of assets. While they may reinforce one another, they do not always align, requiring leaders and policymakers to balance short-term financial imperatives with long-term heritage goals (Psomadaki et al., 2019; Wu et al., 2024; Xu et al., 2025).
Despite growing academic discourse on smart cities, tourism resilience, and digital heritage, a significant gap persists in understanding the causal impact of specific leadership attributes, like a CEO ’s digital vision, on these critical outcomes (Kummitha, 2018; Vitalisovaet al., 2024; Wu et al., 2024). Existing literature often generalizes digital benefits or focuses on broad policy, neglecting rigorous empirical isolation of proactive CEO leadership in leveraging smart city environments for firm-level resilience and heritage preservation. Specifically, the mechanisms through which a CEO ’s strategic emphasis on digital transformation translates into measurable improvements, and whether these effects are uniform across different firm types, remain largely unexplored.
This study aims to bridge this critical gap by employing a Difference-in-Differences (DID) quasi- experimental design. Our primary research question is: How does a CEO ’s digital vision in smart cities causally impact tourism enterprises ’ resilience and digital heritage preservation efforts? We further investigate if this impact varies across firms of different sizes and to what extent investment in digital infrastructure mediates this relationship. By employing a robust DID methodology, we provide compelling evidence of the causal link, controlling for confounding factors and pre-existing trends. Our contribution is both theoretical, extending strategic leadership and smart city discourse, and practical, offering critical insights for tourism industry leaders, urban planners, and policy- makers on cultivating digital vision for future disruptions and heritage engagement.
The remainder of this paper is structured as follows. In next section, we provide a comprehensive review of the relevant literature and develops our theoretical framework, culminating in testable hypotheses. Then, we detail our methodology and data and present empirical results. Finally, we discuss the implications of our findings, acknowledges the limitations, and suggests avenues for future research.
Literature review and theoretical framework
CEO digital vision and organizational performance
In the contemporary business landscape, marked by pervasive digitalization and rapid techno- logical advancements, the strategic orientation of top executives, specifically their digital vision, has emerged as a pivotal determinant of organizational performance and competitive advantage (Hart and Quinn, 1993; Kor and Mesko, 2013; Teece, 2014). This digital vision extends beyond mere technology adoption; it embodies a CEO ’s profound understanding of how digital technologies can fundamentally transform business models, operational processes, customer relationships, and value creation (Reuter and Floyd, 2024). It signifies a proactive and forward- looking mindset that anticipates digital disruptions, strategically positioning the firm to capitalize on nascent digital opportunities.
A digitally visionary CEO not only perceives opportunities but also identifies barriers — such as resource constraints, lack of digital skills, or cultural resistance — that often prevent firms, especially smaller and resource-constrained ones, from capitalizing on smart city opportunities. Overcoming these barriers requires a willingness to invest in digital infrastructure, foster data-driven decision- making, and champion skill development across the workforce (Hanelt et al., 2021; Szukits and Móricz, 2024). This top-down commitment is essential, as digital transformation represents a profound organizational change demanding advocacy and cross-functional collaboration to over- come inertia. Empirical evidence consistently demonstrates a positive association between CEO digital leadership and enhanced firm performance, including innovation, agility, and financial outcomes (Han et al., 2025; Khaw et al., 2022; Weber et al., 2022; Wu et al., 2023). In the highly dynamic tourism industry, where consumer behaviors and external shocks necessitate rapid ad- aptation, a CEO ’s digital vision becomes particularly salient, enabling firms to develop robust digital platforms for customer engagement, optimize operational efficiency, and innovate service offerings, thereby strengthening overall organizational capabilities.
Smart cities and the evolving tourism landscape
The concept of a smart city represents an urban development paradigm that integrates advanced technologies, such as IoT, big data, and AI, to improve the efficiency of city operations, enhance the quality of life for residents, and foster sustainable economic growth (Yao, 2022; Zhao et al., 2025). Smart cities leverage digital infrastructure to collect and analyze vast amounts ofdata, enabling more informed decision- making across various urban domains, including transportation, energy, public safety, and tourism.
The emergence of smart cities has profoundly reshaped the tourism landscape, giving rise to the concept of smart tourism (Bibri et al., 2023). Smart tourism is characterized by the application of smart technologies to enhance the entire tourist experience, from pre-trip planning and in-destination activities to post-trip sharing. This includes personalized recommendations, real-time information on attractions and services, seamless payment systems, and interactive digital content. From a destination management perspective, smart tourism facilitates better resource allocation, crowd management, and environmental monitoring, contributing to more sustainable and efficient tourism ecosystems (Chen, 2022).
While smart city initiatives provide a fertile ground for digital innovation in tourism, their benefits are not uniformly distributed among all tourism enterprises. The extent to which individual firms can capitalize on the digital assets and infrastructure provided by a smart city depends heavily on their internal capabilities and strategic alignment. Firms that proactively integrate smart city data streams into their operations, adopt new digital tools, and innovate their service delivery are more likely to thrive in this environment (El-Haddadeh, 2020). This internal capacity to absorb and leverage external digital opportunities is precisely where the CEO ’s digital vision plays a crucial role. A CEO with a strong digital vision is more likely to recognize and exploit the synergies between their firm ’s strategy and the smart city ’s digital ecosystem, thereby transforming urban digital infrastructure into a competitive advantage for their enterprise.
Tourism resilience in a volatile world
The tourism industry is inherently susceptible to a wide array of external shocks, including economic recessions, natural disasters, political instability, and global pandemics (Cheer et al., 2021; Persson- Fischer and Liu, 2021). This volatility underscores the critical importance of ‘tourism resilience ’, defined as the capacity of tourism systems — destinations, businesses, and communities — to anticipate, adapt to, and recover from disruptive events while maintaining their core functions and identity (Gossling et al., 2023). While traditional resilience approaches often focus on financial diversification or crisis communication (Aydogan et al., 2023; Ritchie and Jiang, 2021), the increasingly interconnected and digitally driven world has elevated the prominence of digital capabilities in fostering this resilience (Isensee et al., 2023). Digital technologies enhance resilience by enabling rapid information dissemination, facilitating remote service delivery, diversifying revenue streams through online platforms, and improving data-driven decision-making during crises. Firms with robust digital systems can, for instance, adapt more quickly to demand shifts or reach new markets during disruptions, thus enhancing their ability to withstand and recover from shocks (Argyroudis et al., 2022). In addition, tourists ’ perceptions and willingness to pay for sustainable services, influenced by cultural values such as ecocentrism and collectivism, play a critical role in reinforcing tourism resilience (Zhou et al., 2025)
A CEO ’s digital vision is hypothesized to be a key driver of a firm ’s digital resilience capabilities. A leader prioritizing digital transformation is more likely to invest in the flexible IT infrastructure, data analytics, and digital talent necessary to withstand and recover from shocks. This proactive digital orientation fosters an organizational culture that is more adaptable, innovative, and capable of leveraging digital tools to maintain operations and explore new business models even under adverse conditions (Wu et al., 2024). In the context of smart cities, which often provide advanced digital infrastructure and data platforms, a CEO ’s digital vision becomes even more potent, enabling firms to fully utilize these urban resources to enhance their inherent resilience.
Digital heritage preservation in the smart era
Cultural and natural heritage represents an invaluable asset for tourism, offering unique experiences and attracting diverse visitor segments. However, heritage sites and artifacts are constantly exposed to threats from environmental degradation, over-tourism, and lack of resources for physical preservation. In this context, digital heritage preservation has emerged as a trans formative approach, leveraging digital technologies to safeguard, manage, and disseminate cultural and historical assets (Liu, 2022; Marra et al., 2021;). This involves the digitization of physical artifacts (e.g., 3D scanning, high-resolution imaging), the creation of virtual replicas of historical sites, the development of augmented reality (AR) and virtual reality (VR) experiences, and the establishment of online archives and interactive platforms.
Digital heritage preservation not only ensures the longevity of cultural assets but also democratizes access to them, allowing a global audience to engage with heritage remotely. Furthermore, it offers new avenues for revenue generation and visitor engagement for tourism enterprises, transforming static heritage sites into dynamic, interactive experiences (Navarrete, 2019). Smart cities, with their emphasis on advanced connectivity, data analytics, and citizen engagement platforms, provide an ideal environment for the development and scaling of digital heritage initiatives. Cultural heritage preservation through sustainable tourism practices also faces significant challenges and opportunities, with an emphasis on balancing commercialization with long-term cultural stewardship (Pai et al., 2025). Smart city infrastructure can support the high- bandwidth requirements for virtual tours, enable real-time data collection on visitor interaction with digital heritage content, and facilitate collaborative projects between cultural institutions, technology providers, and tourism businesses.
The successful integration of digital heritage preservation into a tourism enterprise’s strategy is not automatic; it requires strategic leadership. A CEO with a strong digital vision is more likely to recognize the dual value of digital heritage—both for cultural stewardship and for business innovation(Dom![]() nguez- Escrig et al., 2019). Such a CEO would champion investments in digitization technologies, foster partnerships with cultural institutions and tech firms, and integrate digital heritage content into the firm’s overall digital marketing and customer experience strategies. This proactive approach ensures that digital heritage is not merely a passive archive but an active component of the tourism offering, contributing to both cultural preservation and commercial viability.
nguez- Escrig et al., 2019). Such a CEO would champion investments in digitization technologies, foster partnerships with cultural institutions and tech firms, and integrate digital heritage content into the firm’s overall digital marketing and customer experience strategies. This proactive approach ensures that digital heritage is not merely a passive archive but an active component of the tourism offering, contributing to both cultural preservation and commercial viability.
Theoretical framework and hypotheses development
Building on the preceding literature, we propose an integrated theoretical framework positioning CEO digital vision as the central antecedent that links smart city infrastructures with firm-level outcomes in Figure 1. This framework explicitly combines the resource-based view (RBV) and dynamic capabilities theory to explain pathways of influence. From the RBV perspective, a CEO ’s
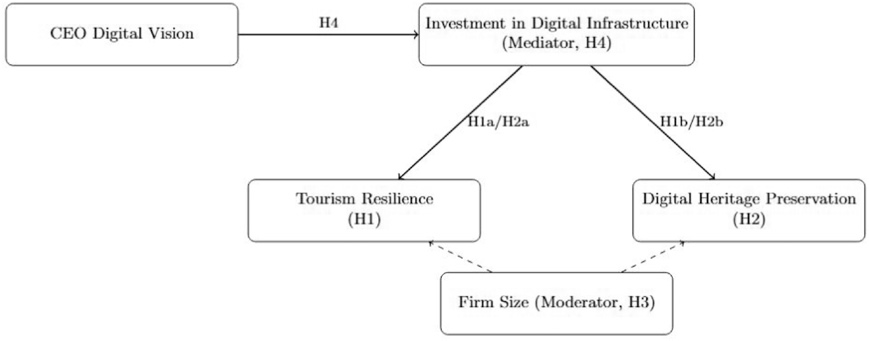
Figure 1. Hypothesis development.
digital vision facilitates the creation of unique resources – such as heritage digitization systems, proprietary data analytics, or customer-facing digital platforms – that are valuable, rare, inimitable, and non-substitutable (VRIN) (Barney et al., 2001). Dynamic capabilities theory adds that these resources must be continuously reconfigured and redeployed in response to shocks, enabling firms to sense opportunities in smart cities, seize them through targeted investments, and reconfigure organizational routines accordingly.
The framework emphasizes temporal and outcome distinctions. Digital investments often generate lagged effects: resilience improvements may appear quickly in recovery metrics but more slowly in revenue stability, while heritage digitization initiatives typically require long time horizons before producing meaningful engagement. Moreover, outcomes can be categorized into commercial engagement (e.g., monetization through digital heritage experiences)and preservation engagement(e.g., safeguarding cultural assets). These forms of engagement do not always align, underscoring the tensions CEO sand policymakers must navigate in balancing short-term competitiveness with long-term cultural stewardship.
Finally, life cycle stage shapes the effectiveness of digital vision. Startups may use it to achieve rapid scaling through city platforms, growth-stage firms to diversify service offerings, mature firms to sustain competitiveness, and declining firms may struggle to reconfigure resources despite infrastructural availability. Taken together, this framework clarifies how CEO digital vision, operating through RBV- driven resource development and dynamic capability reconfiguration, produces heterogeneous, time- sensitive effects on resilience and heritage preservation in smart cities.
Specifically, we argue that a CEO’s digital vision drives the firm’s proactive engagement with digital transformation, leading to enhanced capabilities in leveraging smart city resources. Firstly, for the impact on tourism resilience, a CEO with a strong digital vision will steer the firm towards investments in flexible digital platforms, real-time data analytics, and diversified digital channels. These capabilities enable the firm to rapidly adapt its operations, communicate effectively with customers, and pivot its offerings in response to external shocks (e.g., pandemics, economic downturns). The smart city context further facilitates this by providing a robust digital backbone and access to public data that can inform agile decision-making. Consequently, firms led by digitally visionary CEOs are expected to exhibit greater stability in revenue and faster recovery times following disruptions.
Hypothesis 1a. Tourism enterprises led by CEOs with a strong digital vision in smart cities will experience a greater increase in tourism resilience, as measured by the Revenue Stability Index, following a smart city digital intervention, compared to firms without such a vision.
Hypothesis 1b. Tourism enterprises led by CEOs with a strong digital vision in smart cities will experience a greater decrease in Occupancy Rate Recovery Time following a smart city digital intervention, compared to firms without such a vision.
Secondly, for the impact on digital heritage preservation, a CEO ’s digital vision is also crucial for recognizing the strategic imperative and commercial potential of digital heritage. Such a leader will champion initiatives to digitize cultural assets, develop immersive digital experiences (e.g., AR/VR tours), and integrate heritage content into broader digital engagement strategies. The smart city environment, with its advanced connectivity and data infrastructure, provides the techno- logical scaffolding for these initiatives. This proactive stance ensures that heritage assets are not only preserved but also actively leveraged to enhance visitor experience and generate new value streams.
Hypothesis 2a. Tourism enterprises led by CEOs with a strong digital vision in smart cities will demonstrate a greater increase in digital heritage preservation, as measured by the Digitized Asset Ratio, following a smart city digital intervention, compared to firms without such a vision.
Hypothesis 2b. Tourism enterprises led by CEOs with a strong digital vision in smart cities will demonstrate a greater increase in digital heritage preservation, as measured by the Digital Engagement Score, following a smart city digital intervention, compared to firms without such a vision.
Thirdly, for the heterogeneity of treatment effects, we posit that the impact of CEO digital vision may not be uniform across all firms. Specifically, larger firms often possess greater financial re- sources, more established digital infrastructure, and larger workforces, which can facilitate the implementation of ambitious digital transformation initiatives. This suggests that while CEO digital vision is beneficial for all, its effects might be amplified in larger organizations due to their greater capacity to absorb and leverage new digital capabilities provided by smart city environments.
Hypothesis 3. The positive causal impact of CEO digital vision on tourism resilience and digital heritage preservation in smart cities will be more pronounced for larger tourism enterprises compared to smaller/medium-sized enterprises.
Finally, for the mediation by investment in digital infrastructure, we propose that a key mechanism through which CEO digital vision translates into enhanced tourism resilience and digital heritage preservation is through increased investment in digital infrastructure. A CEO with a clear digital vision is more likely to allocate significant financial and organizational resources towards building robust digital foundations, including advanced IT systems, data analytics platforms, and specialized digital tools. These tangible investments, in turn, directly enable the firm to develop the capabilities necessary for greater resilience and effective digital heritage initiatives.
Hypothesis 4. Investment in digital infrastructure mediates the positive causal impact of CEO digital vision on (a) tourism resilience and (b) digital heritage preservation in smart cities
Data and methodology
Data selection
This study employs a Difference-in-Differences (DID) quasi-experimental design to investigate the
causal impact of CEO digital vision within smart cities on tourism resilience and digital heritage preservation among tourism enterprises. The DID approach is particularly suited for this inquiry as it allows for the estimation of a causal effect by comparing changes in outcomes over time between a ‘treatment’ group (tourism enterprises with high CEO digital vision) and a ‘control’ group(comparable firms with low digital vision), before and after a significant smart city digital intervention. This design effectively controls for both time-invariant unobserved heterogeneity and common time trends.
Our analysis utilizes the Global Urban Tourism & Heritage Data Archive (GUTHDA), a comprehensive multi-year data set spanning 2015 to 2024. This archive integrates financial performance, organizational characteristics, digital adoption records, and smart city policy implementations for tourism enterprises across 50 globally identified smart cities. The initial sample comprises 1,200 unique tourism enterprises with continuous operational records throughout the period, ensuring sufficient pre- and post-intervention data.
A critical step in our DID design involved robustly identifying the treatment and control groups. The ‘treatment’ is defined as the official launch and significant public implementation of a city-wide Smart Tourism Platform (STP) by municipal authorities. We identified 25 cities in our sample that implemented such STPs between 2018 and 2021, with the specific launch year serving as the intervention point for each treated city. To differentiate firms based on their CEO ’s digital vision, we employed a multi-pronged approach. This involved using natural language processing (NLP) to analyze annual reports and public statements from 2015 to 2017 (pre-intervention), quantifying the prominence of keywords related to digital transformation. Additionally, firm-level investment in digital infrastructure and R&D for digital solutions during the same period was extracted. Firms whose CEOs consistently scored in the top quartile across both measures were assigned to the ‘treatment’ group, representing proactive digital vision. A control group was then constructed using propensity score matching (PSM) based on pre-intervention firm characteristics (e.g., size, age, industry sub-sector, growth rates), ensuring comparability with the treatment group.
For dependent variables, tourism resilience is operationalized by the Revenue Stability Index (inverse of quarterly revenue growth coefficient of variation) and Occupancy Rate Recovery Time (days to return to 90% of pre-shock occupancy). Digital heritage preservation is measured via a composite index comprising Digitized Asset Ratio, Digital Engagement Score, and Digital Heritage Investment. The independent variable, CEO Digital Vision, is a binary dummy. Treatment variables include a binary Treatment Group Indicator and a binary Post-Intervention Period Indicator. To mitigate confounding effects, firm-level controls and city-level controls are included.
Difference-in-differences (DID) model
Our primary econometric model is a two-way fixed effects DID regression, specified as follows:
Yit = β0 + β 1 (Ti × Postt )+ β2 Ti + β3Postt + Xitγ + αi + δt + εit
In this model, Yit represents the outcome variable (Tourism Resilience or Digital Heritage Preservation) for firm i in year t Ti is the treatment group indicator (1 if firm i is in the treatment group, 0 otherwise). Postt is the post-intervention period indicator (1 for years after the STP launch, 0 for years before). The interaction term (Ti × Postt) is central to the DID estimation, and its coefficient β1 is the DID estimator, representing the average causal effect of CEO digital vision in smart cities on the outcome variables. Xit is a vector of time-varying control variables for firm i in year t αi represents firm-fixed effects, controlling for all unobserved, time-invariant characteristics specific to each firm. δt represents year-fixed effects, controlling for common macroeconomic shocks or trends affecting all firms in the sample. Finally, εit is the idiosyncratic error term.
The validity of the DID estimator critically relies on the parallel trends assumption: that treatment and control groups would have followed parallel outcome trends without the intervention. We assess this graphically and by including pre-treatment interaction terms in an extended DID model; in- significant coefficients for these terms support the assumption. Other key assumptions include no anticipation, meaning firms do not adjust behavior before the STP launch, and stable composition, ensured by selecting firms with continuous operational records throughout the study period.
Results
This section presents the empirical findings derived from the Difference-in-Differences (DID) analysis, examining the causal impact of CEO digital vision within smart cities on tourism resilience and digital heritage preservation. The presentation begins with descriptive statistics of the variables, followed by an assessment of the parallel trends assumption, and concludes with the main DID regression results and a discussion of robustness checks.
Descriptive statistics
Table 1 provides the descriptive statistics for all variables included in our analysis. The sample consists of 1,200 unique tourism enterprises observed over a 10-year period (2015—2024), yielding a total of 12,000 firm-year observations. The mean Revenue Stability Index is 0.75, with a standard deviation of 0.15, indicating some variability in revenue performance across firms. The average Occupancy Rate Recovery Time is 45 days, reflecting the typical period for recovery from minor disruptions. For Digital Heritage Preservation, the Digitized Asset Ratio averages 0.30, suggesting that on average, 30% of identified heritage assets have been digitized. The Digital Engagement Score has a mean of 6.8, indicating moderate online engagement with heritage content. The CEO Digital Vision variable, being binary, shows that approximately 25% of the CEOs in our sample demonstrated high digital vision in the pre-intervention period. Control variables such as Firm Size, Firm Age, and Pre-Intervention Performance also exhibit reasonable distributions, providing a solid foundation for the regression analysis.
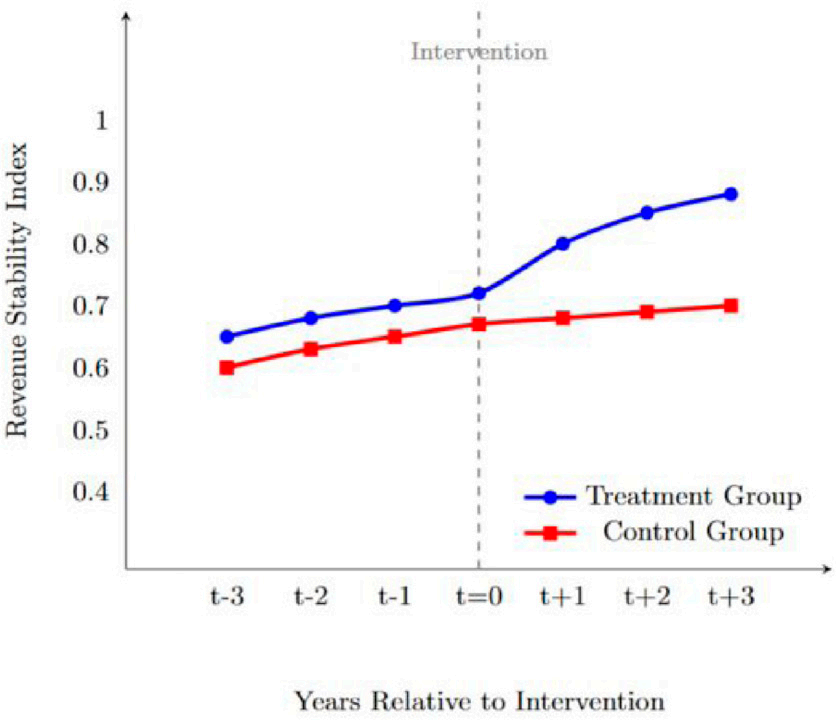
A critical assumption for the validity of the DID estimator is that, in the absence of the smart city digital intervention, the treatment and control groups would have followed parallel trends in their outcome variables. We assessed this assumption through both graphical inspection and a formal event study analysis. Figure 2 illustrates the average trends of the Revenue Stability Index for both treatment and control groups from 3 years prior to the intervention (t-3) to 3 years post-intervention (t + 3). As depicted, the pre-intervention trends for both groups appear remarkably parallel, suggesting that their outcomes were evolving similarly before the Smart Tourism Platform (STP) launch. A similar pattern was observed for the Digital Heritage Preservation metrics.
Table 2 presents the coefficients for these pre-treatment interaction terms. As shown, none of the coefficients for the pre-treatment interactions are statistically significant, providing strong empirical
Table 1. Descriptive statistics.
Variable |
N |
Mean |
Std. Dev. |
Min |
Max |
Dependent variables Tourism resilience (revenue stability index) Tourism resilience (occupancy rate recovery time, days) Digital heritage preservation (digitized asset ratio) Digital heritage preservation (digital engagement score) Independent variable CEO digital vision (CEO_DigitalVision_i) Treatment variables Treatment group indicator (T_i) Post-intervention period (Post_t) Control variables Firm size (Log total assets) Firm age (Log years) Pre-intervention revenue growth (%) Pre-intervention EBITDA margin (%) City GDP growth (%) Overall smart city index score Tourism demand index |
12,000 |
0.75 |
0.15 |
0.30 |
0.98 |
7,500 |
45.2 |
18.7 |
15 |
120 |
|
12,000 |
0.30 |
0.12 |
0.05 |
0.75 |
|
12,000 |
6.8 |
2.1 |
2.0 |
10.0 |
|
12,000 |
0.25 |
0.43 |
0 |
1 |
|
12,000 |
0.25 |
0.43 |
0 |
1 |
|
12,000 |
0.40 |
0.49 |
0 |
1 |
|
12,000 |
7.2 |
1.5 |
4.0 |
10.5 |
|
12,000 |
2.8 |
0.8 |
1.0 |
4.5 |
|
12,000 |
5.8 |
2.3 |
0.5 |
12.0 |
|
12,000 |
18.5 |
5.1 |
8.0 |
30.0 |
|
12,000 |
3.2 |
1.1 |
1.0 |
6.0 |
|
12,000 |
78.5 |
8.2 |
60.0 |
95.0 |
|
12,000 |
105.0 |
10.0 |
85.0 |
125.0 |
support for the parallel trends assumption. This indicates that there were no significant differential pre-trends between the treatment and control groups that could confound our DID estimates.
Main results
Table 3 presents the main DID regression results for our two primary dependent variables: Tourism Resilience (measured by Revenue Stability Index and Occupancy Rate Recovery Time) and Digital Heritage Preservation (measured by Digitized Asset Ratio and Digital Engagement Score). All models include firm-fixed effects, year-fixed effects, and the comprehensive set of control variables as specified in the methodology section. Standard errors are clustered at the city level.
The key finding is represented by the coefficient of the interaction term. For Tourism Resilience in Column 1, the coefficient is 0.085 and is statistically significant at the 1% level. This indicates that tourism enterprises led by CEOs with high digital vision experienced an 8.5 percentage point greater increase in their Revenue Stability Index after the smart city digital intervention, compared to firms with low digital vision. Similarly, for Occupancy Rate Recovery Time in column 2, the interaction term is -8.20 and is significant at the 1% level. This suggests that firms with high CEO digital vision reduced their recovery time by 8.2 days more than their low digital vision counterparts following the intervention. These results strongly support the hypothesis that CEO digital vision positively impacts tourism resilience in smart city contexts.
Regarding Digital Heritage Preservation, the interaction term for Digitized Asset Ratio in column 3 is 0.065. This implies that firms with high CEO digital vision increased their proportion of digitized heritage assets by 6.5 percentage points more than control firms after the smart city intervention. Furthermore, for Digital Engagement Score in column 4, the interaction term is 1.50, which indicates a 1.5 point greater increase in digital engagement with heritage content for the
treatment group. These findings provide robust evidence that CEO digital vision plays a significant role in promoting digital heritage preservation efforts within smart urban environments.
The coefficients for the control variables generally align with expectations. For instance, larger firms and older firms tend to exhibit higher resilience and engagement with digital heritage, although the effects are modest. City GDP growth and the overall Tourism Demand Index also show positive associations with the outcome variables, highlighting the importance of broader economic and market conditions. The coefficients for T i and Post t capture the baseline differences between groups and the general time trend, respectively, and are interpreted in conjunction with the interaction term.
Heterogeneity of treatment effects
Beyond the average treatment effect, it is crucial to explore whether the causal impact of CEO digital vision varies across different types of firms. We investigate the heterogeneity of treatment effects by examining the moderating role of firm size, hypothesizing that larger firms, with potentially greater resources and established digital infrastructure, might experience a different magnitude of impact compared to smaller firms. We categorize firms into ‘Small/Medium’ (below median total assets) and ‘Large’ (at or above median total assets) and introduce a triple interaction term into our DID models.
Table 4 presents the DID coefficients for the treatment effect for both small/medium and large firms. For Tourism Resilience, represented by Revenue Stability Index, the DID effect is significant for both small/medium firms and large firms. The larger coefficient for large firms suggests that
Table 2. Parallel trends test.
Coefficient |
Std. error |
p-value |
Dependent variable: revenue stability index |
||
Ti × Year-3 0.002 |
(0.005) |
0.701 |
Ti × Year-2 -0.003 |
(0.006) |
0.612 |
Ti × Year- 1 0.001 Dependent variable: occupancy rate recovery time |
(0.004) |
0.825 |
Ti × Year-3 0.15 |
(0.80) |
0.852 |
Ti × Year-2 -0.20 |
(0.95) |
0.833 |
Ti × Year- 1 0.08 Dependent variable: digitized asset ratio |
(0.70) |
0.909 |
Ti × Year-3 -0.001 |
(0.002) |
0.750 |
Ti × Year-2 0.000 |
(0.001) |
0.980 |
Ti × Year- 1 0.002 Dependent variable: digital engagement score |
(0.002) |
0.500 |
Ti × Year-3 0.05 |
(0.12) |
0.670 |
Ti × Year-2 -0.08 |
(0.15) |
0.590 |
Ti × Year- 1 0.03 |
(0.10) |
0.780 |
Note. Standard errors clustered at the city level in parentheses. Year 0 is the intervention year.
while CEO digital vision is beneficial for all, its impact on revenue stability is more pronounced in larger tourism enterprises within smart cities. A similar pattern is observed for Occupancy Rate Recovery Time, where the negative DID coefficient is larger in magnitude for large firms compared to small/medium firms, indicating faster recovery for larger entities.
Regarding Digital Heritage Preservation, the Digitized Asset Ratio shows a significant positive DID effect for both small/medium and large firms, with a stronger effect for larger firms. The Digital Engagement Score also follows this trend, with a greater increase for large firms compared to small/medium firms. These findings suggest that while CEO digital vision universally enhances digital heritage preservation, larger firms may be better positioned to capitalize on this vision, potentially due to greater capacity for investment, specialized digital teams, or broader reach within the smart city ecosystem.
Mediation analysis
We explore the mechanisms through which CEO digital vision influences tourism resilience and digital heritage preservation via a mediation analysis, as conceptualized in Figure 2. We hypothesize that CEO digital vision leads to increased Investment in Digital Infrastructure, operationalized as annual expenditure on digital technologies (e.g., cloud computing, IoT, AR/VR) as a percentage of total operating expenditure.
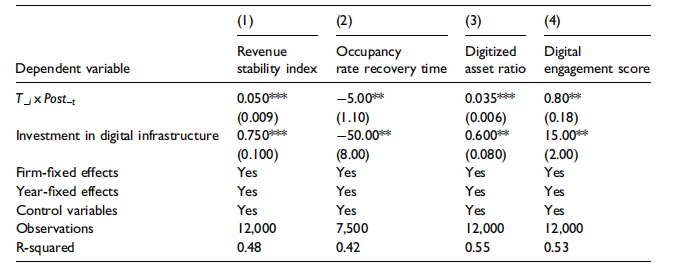
The analysis follows a two-step causal mediation framework. First, we examine the treatment’s effect on the mediator. As shown in Table 5, Panel A, the interaction term for Investment in Digital Infrastructure is 0.045 (p < 0.01), indicating that firms with high CEO digital vision increased their digital infrastructure investment by 4.5 percentage points more than control firms post-intervention. This supports that CEO digital vision actively drives tangible digital investments.
Second, we assess the mediator ’s effect on outcomes while controlling for direct treatment effects (Table 5, Panel B). Including Investment in Digital Infrastructure in the model reduces the DID coefficients for all outcome variables compared to main effects (Table 3), while generally retaining
Table 3. Difference-in-differences regression results.
Dependent variable |
(1) |
(2) |
(3) |
(4) |
Revenue stability index |
Occupancy rate recovery time |
Digitized asset ratio |
Digital engagement score |
|
T i × Post t |
0.085* |
-8.20* |
0.065* |
1.50* |
T i |
(0.012) |
(1.50) |
(0.008) |
(0.25) |
-0.010 |
1.50 |
-0.005 |
0.10 |
|
Post t |
(0.008) |
(1.20) |
(0.004) |
(0.15) |
0.025** |
-2.80* |
0.015* |
0.30* |
|
(0.010) |
(1.00) |
(0.007) |
(0.18) |
|
Firm size |
0.008 |
-0.50 |
0.003 |
0.05 |
Firm age |
(0.005) |
(0.40) |
(0.002) |
(0.03) |
0.012* |
-1.20* |
0.007* |
0.18* |
|
Pre-intervention revenue growth |
(0.006) |
(0.60) |
(0.003) |
(0.08) |
0.003 |
-0.10 |
0.001 |
0.02 |
|
(0.002) |
(0.08) |
(0.001) |
(0.01) |
|
Pre-intervention EBITDA margin |
0.001 |
-0.05 |
0.000 |
0.01 |
City GDP growth |
(0.001) |
(0.04) |
(0.000) |
(0.005) |
0.015** |
-1.80** |
0.008** |
0.25** |
|
Overall smart city index score |
(0.007) |
(0.80) |
(0.004) |
(0.10) |
0.002 |
-0.10 |
0.001 |
0.03 |
|
(0.001) |
(0.05) |
(0.000) |
(0.01) |
|
Tourism demand index |
0.005* |
-0.40* |
0.002* |
0.08* |
Firm-fixed effects |
(0.003) Yes |
(0.20) Yes |
(0.001) Yes |
(0.04) Yes |
Year-fixed effects |
Yes |
Yes |
Yes |
Yes |
Observations |
12,000 |
7,500 |
12,000 |
12,000 |
R-squared |
0.45 |
0.38 |
0.52 |
0.49 |
Adjusted R-squared |
0.44 |
0.37 |
0.51 |
0.48 |
Note. *p <<> 0.1, **p <<> 0.05, ***p <<> 0.01 . Standard errors clustered at the city level in parentheses.
significance. For instance, the Revenue Stability Index coefficient decreases from 0.085 to 0.050, and Digitized Asset Ratio from 0.065 to 0.035. Concurrently, digital infrastructure investment shows a significant positive association with all outcomes. This pattern suggests that Investment in Digital Infrastructure partially mediates the relationship between CEO digital vision and both tourism resilience and digital heritage preservation (Figure 3).
Robustness checks
To ensure the reliability and consistency of our main findings, we conducted several robustness checks, the results of which are summarized in Tables6 and 7. These checks explore the sensitivity of our primary DID estimates to alternative model specifications, treatment definitions, and sample compositions.
Table 6 presents the DID coefficients for the Tourism Resilience outcomes (Revenue Stability Index and Occupancy Rate Recovery Time) under various robustness scenarios. The first row replicates the main DID estimates from Table 3 for comparison. Subsequent rows show the results
Table 4. Heterogeneity of treatment effects by firm size (DID coefficients).
Dependent variable (1) |
(2) |
(3) |
(4) |
CEO digital vision × post-intervention |
|||
Small/medium firms 0.070*** |
-7.00*** |
0.055*** |
1.20*** |
(0.010) |
(1.30) |
(0.007) |
(0.20) |
Large firms 0.105*** |
-9.50*** |
0.075*** |
1.80*** |
(0.015) |
(1.80) |
(0.009) |
(0.30) |
when using alternative thresholds for defining ‘high digital vision’ (top 20% and top 30% of CEOs), performing placebo tests by randomly assigning treatment, excluding specific sub-sectors (accommodation providers), and including additional city-level policy controls. For the Revenue Stability Index, the DID coefficient consistently remains positive and statistically significant at the 1% level across all robustness checks, ranging from 0.082 to 0.088. Similarly, for Occupancy Rate Recovery Time, the DID coefficient consistently remains negative and statistically significant at the
Table 5. Mediation analysis results (mediator: investment in digital infrastructure).
Panel A: effect of treatment on mediator |
||
Dependent variable |
(1) Investment in digital infrastructure |
|
T i × Post t |
0.045*** (0.007) |
|
Firm-fixed effects |
Yes |
|
Year-fixed effects |
Yes |
|
Control variables |
Yes |
|
Observations |
12,000 |
|
R-squared |
0.35 |
|
Panel B: effect of mediator on outcomes (controlling for treatment) |
||
*Standard errors clustered at the city level in parentheses. **p < 0.01.<> Note. Standard errors clustered at the city level in parentheses.
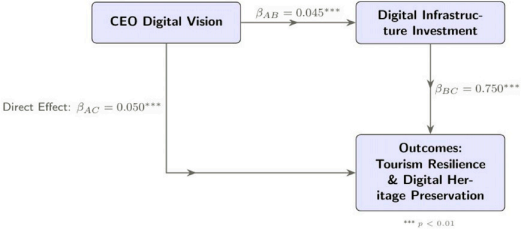
Figure 3. Conceptual mediation model of CEO digital vision’s impact.
1% level, ranging from -7.90 to -8.55 (indicating faster recovery). Importantly, in the placebo tests, the DID coefficients for both resilience measures are close to zero and statistically insig- nificant, confirming that our observed effects are not due to random chance. These findings col- lectively affirm the robustness of the positive causal impact of CEO digital vision on tourism resilience.
Table 7 presents the DID coefficients for the Digital Heritage Preservation outcomes (Digitized Asset Ratio and Digital Engagement Score) under the same set of robustness checks. The first row again provides the main DID estimates from Table 3. Across all alternative specifications, the DID coefficient for Digitized Asset Ratio remains positive and statistically significant, similarly for Digital Engagement Score. As with the resilience measures, the placebo tests for digital heritage
Table 6. Robustness checks for tourism resilience outcomes.
Robustness check scenario |
(1) |
(2) |
Main DID estimate (from Table 3)
Alternative CEO digital vision thresholds Top 20% threshold Top 30% threshold Placebo test (randomized treatment) Excluding accommodation providers Including additional city-level controls |
0.085* (0.012) 0.088*** (0.013) 0.082*** (0.011) 0.001 (0.009) 0.083*** (0.013) 0.084*** (0.012) |
-8.20* (1.50) -8.55*** (1.60) -7.90*** (1.45) 0.15 (1.10) N/A -8.18*** (1.52) |
Table 7. Robustness checks for digital heritage preservation outcomes.
Robustness check scenario |
(3) |
(4) |
Main DID estimate (from Table 3) |
0.065* |
1.50* |
Alternative CEO digital vision thresholds Top 20% threshold |
(0.008) 0.068*** |
(0.25) 1.55*** |
Top 30% threshold |
(0.009) 0.062*** |
(0.26) 1.45*** |
Placebo test (randomized treatment) |
(0.007) -0.000 |
(0.24) 0.02 |
Excluding cultural attractions |
(0.005) 0.064*** |
(0.18) 1.49*** |
Including additional city-level controls |
(0.008) 0.064*** (0.008) |
(0.25) 1.49*** (0.25) |
Note. All models include firm-fixed effects, year-fixed effects, and control variables. Standard errors clustered at the city level in parentheses. p <<> 0.01 . N/A for occupancy rate Recovery time when accommodation providers are excluded.
preservation yield statistically insignificant coefficients, further validating the causal interpretation of our main findings.
Conclusion and implications
Conclusion
This study empirically investigated the causal impact of CEO digital vision within smart cities on tourism resilience and digital heritage preservation. Using a robust DID design and a comprehensive panel dataset, our analysis provides novel insights into leadership’s strategic role in digital transformation and urban development. Our findings offer compelling evidence that a CEO’s proactive digital vision significantly enhances organizational capabilities in the contemporary tourism landscape.
Our primary analysis revealed a statistically significant positive causal effect of CEO digital vision, combined with smart city digital interventions, on both tourism resilience and digital heritage pres- ervation. Specifically, firms led by digitally visionary CEOs experienced greater revenue stability and faster recovery times post-disruptions, alongside more pronounced increases in heritage digitization and digital cultural engagement. These core findings underscore the transformative power of strategic digital leadership in fostering organizational robustness and cultural stewardship. Furthermore, our hetero- geneity analysis indicated these positive impacts were more pronounced for larger tourism enterprises, suggesting they are better positioned to capitalize on digital directives. Mediation analysis revealed that increased investment in digital infrastructure partially mediates this relationship, highlighting how a CEO’s digital foresight translates into tangible resource allocation that directly contributes to resilience and preservation, though other intangible factors also play a vital role.
Theoretical implications
This study offers several significant theoretical implications. First, it enriches strategic leadership literature by providing empirical evidence of the causal impact of CEO digital vision on firm-level
outcomes. Moving beyond mere correlations, we demonstrate how a CEO’s strategic digital orientation translates into measurable improvements in organizational resilience and engagement with digital heritage. This extends the resource-based view and dynamic capabilities theory, illustrating how a CEO’s vision proactively shapes the development of valuable digital resources and capabilities essential for competitive advantage in the smart era. Concurrently, our findings contribute to the literature on smart cities and smart tourism. While existing research often focuses on macro-level benefits, our study provides a crucial micro-level perspective, demonstrating how individual tourism enterprises leverage city-wide digital ecosystems. We show that smart city infrastructure benefits are not automatic but depend critically on internal strategic alignment and digital leadership, highlighting firms’ ‘absorptive capacity’ in translating external technological opportunities into organizational gains.
Second, this research advances the understanding of tourism resilience. Identifying CEO digital vision as a key antecedent expands resilience conceptualization beyond traditional risk management. Our findings emphasize the proactive role of digital capabilities, driven by top leadership, in enabling firms to adapt, respond, and recover from disruptions, underscoring digital transformation ’s role in building fundamental organizational robustness. Finally, our study contributes to the nascent field of digital heritage preservation. We empirically demonstrate how a CEO ’s digital vision drives tangible efforts in digitizing cultural assets and fostering digital engagement. This bridges the gap between technological potential and strategic implementation, illustrating how business leaders can safeguard cultural legacy while creating new value streams within the tourism sector, highlighting the dual imperative of cultural stewardship and commercial viability.
Practical implications
The findings of this study carry significant implications for diverse stakeholders in the tourism ecosystem. For CEOs and top management in tourism enterprises, nurturing a strong and proactive digital vision is a strategic imperative. Investing in digital infrastructure, fostering a data-driven culture, and championing digital skill development are crucial for building resilient organizations capable of navigating future disruptions. A digitally visionary CEO can transform external smart city initiatives into internal competitive advantages, leading to more reliable revenue streams and faster recovery from unforeseen crises. Furthermore, recognizing the commercial and cultural value of digital heritage and actively integrating its preservation into business strategy can unlock new avenues for engagement and revenue.
This research highlights that for urban planners, smart city developers, and DMOs, it is crucial to cultivate an environment that encourages private sector involvement in digital initiatives. While pro- viding robust digital infrastructure is necessary, these organizations should also implement programs that help tourism businesses improve their internal digital skills and leadership. Such programs could include digital literacy training for business leaders, creating platforms for data exchange between city authorities and tourism firms, and offering incentives for digital heritage projects. By recognizing that the impact of smart city investments is amplified by visionary corporate leadership, policymakers can develop more effective interventions to promote digital transformation across a destination.
A critical implication emerging from our findings is the centrality of investment in digital infrastructure for building resilience. Cloud-based systems, secure data architectures, and real- time analytics platforms provide the technical foundation for firms to withstand shocks ranging from pandemics to cyberattacks. For policymakers and industry leaders, this underscores that smart city interventions must be coupled with strong digital infrastructure development at the firm level to ensure that resilience and digital heritage preservation translate into sustainable tourism growth.
Limitations and future research
Despite its robust methodology and significant contributions, this study is subject to certain lim- itations that offer avenues for future research. First, our measurement of CEO digital vision relies on proxies from public data; future work could utilize more granular qualitative measures or direct executive surveys to capture strategic intent more precisely. Second, while we focused on a city- wide Smart Tourism Platform, future research could investigate the impact of other smart city initiatives or combinations thereof, and assess the long-term sustainability of the observed effects beyond the immediate post-intervention period. Third, although digital infrastructure investment partially mediates the relationship, other potential mechanisms, such as organizational agility, employee digital literacy, or specific digital business models, warrant further exploration to fully understand the ‘black box ’ between CEO vision and firm outcomes.
Finally, while our findings are supported by a diverse global sample, cross-country comparative studies, especially in developing economies, could enhance generalizability by exploring how varying regulatory environments, cultural contexts, and industry sub-sectors moderate these re- lationships. In conclusion, this study provides compelling evidence that a CEO ’s digital vision, particularly within smart city development, is a powerful catalyst for enhancing tourism resilience and advancing digital heritage preservation. As the world continues its rapid digital evolution and urban centers embrace smart technologies, the strategic leadership demonstrated by CEOs will be paramount in shaping the future trajectory of tourism enterprises, ensuring both their economic vitality and their role as custodians of cultural legacy.
ORCID iD
Ying Wei ® https://orcid.org/0009-0008-1864-8717
Funding
The author(s) received no financial support for the research, authorship, and/or publication of this article.
Declaration of conflicting interests
The author(s) declared no potential conflicts of interest with respect to the research, authorship, and/or publication of this article.
References
Argyroudis SA, Mitoulis SA, Chatzi E, et al. (2022) Digital technologies can enhance climate resilience of critical infrastructure. Climate Risk Management 35: 100387.
Aydogan M, de E, Curiel J, et al. (2023) Characteristics of crisis-resilient organizations in the hospitality and tourism industry. International Journal of Contemporary Hospitality Management 36(4): 1432–1453.
Barney J, Wright M and Ketchen JDJ (2001) The resource-based view of the firm: ten years after 1991. Journal of Management 27(6): 625–641.
Barufi AMB and Kourtit K (2015) Chapter 2: Agglomeration economies and smart cities. Available at:
https://www.elgaronline.com/edcollchap/edcoll/9781783475353/9781783475353.00008.xml
(Accessed 17 July 2025).
Bibri SE (2019) The anatomy of the data-driven smart sustainable city: instrumentation, datafication, computerization and related applications. Journal of Big Data 6(1): 1–43.
Bibri SE, Alexandre A, Sharifi A, et al. (2023) Environmentally sustainable smart cities and their converging AI, IoT, and big data technologies and solutions: an integrated approach to an extensive literature review. Energy Informatics 6(1): 9.
Cheer JM, Lapointe D, Mostafanezhad M, et al. (2021) Global tourism in crisis: conceptual frameworks for research and practice. Journal of Tourism Futures 7(3): 278–294.
Chen G (2022) Tourism management strategies under the intelligent tourism IoT service platform. Computational Intelligence and Neuroscience 2022: 7750098.
Dominguez-Escrig E, Mallen-Broch FF, Lapiedra-Alcam R, et al. (2019) The influence of leaders’ stewardship behavior on innovation success: the mediating effect of radical innovation. Journal of Business Ethics 159(3): 849–862.
El-Haddadeh R (2020) Digital innovation dynamics influence on organisational adoption: the case of cloud computing services. Information Systems Frontiers 22(4): 985–999.
Fan Y, Wang R, Alkaraan F, et al. (2025) Decoding greenwashing practices toward sustainability: the synergistic influence of governance structure and policy-driven rhetorical strategies. Energy Economics 148: 108632.
Available at: https://doi.org/10.1016/j.eneco.2025.108632
Fan Y, Wang X, Li Z, et al. (2025) From harm to hope: how green innovation alleviates environmental injustice triggered by non-green innovation. International Review of Economics & Finance 101: 104122.
Gössling S, Balas M, Mayer M, et al. (2023) A review of tourism and climate change mitigation: the scales, scopes, stakeholders and strategies of carbon management. Tourism Management 95: 104681.
Han Z, Tang S and Li Z (2025) Design innovation and firm performance: evidence from patent subtype analysis. International Review of Economics & Finance 102: 104363.
Hanelt A, Bohnsack R, Marz D, et al. (2021) A systematic review of the literature on digital transformation: insights and implications for strategy and organizational change. Journal of Management Studies 58(5): 1159–1197.
Hart SL and Quinn RE (1993) Roles executives play: CEOs, behavioral complexity, and firm performance. Human Relations 46(5): 543–574.
Hu J, Xu Z, Wan LC, et al. (2025) The unintended sustainable consequences of free upgrade: how unearned preferential treatment reduces sustainable behavior. Annals of Tourism Research 110: 103872.
Isensee C, Teuteberg F and Griese KM (2023) Success factors of organizational resilience: a qualitative investigation of four types of sustainable digital entrepreneurs. Management Decision 61(5): 1244–1273.
Khaw TY, Teoh AP, Khalid SNA, et al. (2022) The impact of digital leadership on sustainable performance: a systematic literature review. The Journal of Management Development 41(9/10): 514–534.
Kor YY and Mesko A (2013) Dynamic managerial capabilities: configuration and orchestration of top executives’ capabilities and the firm’s dominant logic. Strategic Management Journal 34: 233–244.
Kummitha RKR (2018) Entrepreneurial urbanism and technological panacea: why Smart City planning needs to go beyond corporate visioning? Technological Forecasting and Social Change 137: 330–339.
Liu J (2022) Digitally protecting and disseminating the intangible cultural heritage in the information technology era. Journal of Sensors 2022: 1115655.
Marra A, Trizio I and Fabbrocino G (2021) Digital tools for the knowledge and safeguard of historical heritage. In: Rainieri C, Fabbrocino G, Caterino N, et al. (eds) Civil Structural Health Monitoring. Springer International Publishing, 645–662.
Mendoza MAD, De La Hoz Franco E and Gómez JEG (2023) Technologies for the preservation of cultural heritage — a systematic review of the literature. Sustainability 15(2): 1059.
Muniz ECL, Dandolini GA, Biz AA, et al. (2021) Customer knowledge management and smart tourism destinations: a framework for the smart management of the tourist experience — SMARTUR. Journal of Knowledge Management 25(5): 1336–1361.
Navarrete T (2019) Digital heritage tourism: innovations in museums. World Leisure Journal 61(3): 200–214. Available at: https://doi.org/10.1080/16078055.2019.1639920


 京公网安备 11010802037854号


