Commentaries
Your Present Location: Teacher_Home> Daryl Guppy> CommentariesMeasuring China’s new economy
Measuring China’s new economy
Source: The Edge Singapore, Press Reader
Update: Jul 27th, 2026

Photo: Shutterstock
Chinese economic figures are like a Chinese banquet. You can select whichever morsels you prefer from a range of dishes. According to many commentators, the latest economic figures show that the Chinese economy is in dire straits, struggling to survive. More advanced economic analysis points to a K-shaped economy, with some parts going up and some parts going down.
For other commentators, the figures show a steady economic situation with slow improvement.
Despite confident predictions that started more than 20 years ago—and which have been repeated every year since—there is no coming collapse of China. Instead, we are watching an economy evolve into a new economy. President Xi Jinping talks of the “new quality productive forces”. These are not empty words, but there is not yet any agreed way to measure this economic impact.
The advanced digital economy in China is not reflected in the economic figures used to compile GDP measures. The GDP figures do not capture the dramatic changes in productivity.
Remember when there were multiple steps involved in processing payroll? First, staff in the accounts department calculated employees’ pay. Someone had to take an hour to go to the bank and collect cash. In a locked office, the cash was counted and put into individual pay packets for each employee. Then, employees had to go to the bank to deposit
their wages. Even in the efficient firms which paid salaries by cheque, there were several staff required to print and authorise each cheque.
Today, hours and complex pay rates are calculated by software, automatically integrated into company accounts, and the money is electronically transferred.
Such changes produced an increase in productivity, but it was not directly measured in economic accounts.
Speaking in relation to Western economies, Paul Donovan, chief economist at UBS Global Wealth Management, notes: “We can’t trust the economic data anymore.
“So much structural change is happening, which we’re missing. We’re missing a lot of the ability to measure productivity gains that are taking place, we’re constantly underestimating economic activity, which means we’re underestimating productivity gains.”
China is much further along the path of economic restructuring. The
changes wrought by the digital and AI economy are greater, but remain largely unseen and unaccounted for by the existing yardsticks of economic measurement.
We still use the traditional measures of economic activity, counting steel production, electricity consumption and retail sales from registered
. businesses. The result is that the traditional measures of GDP and productivity do not reflect the true economic situation. This mis-measurement feeds the Western narrative that the Chinese economy is in trouble.
This is the fourth industrial revolution. The new digital economy is going to require new measures of success because the existing GDP measures are no longer fit for the purpose. Until they change, the real growth in the Chinese economy will not be measured accurately.
To be sure, the old metrics and economic measurements are important, but they no longer tell the full story.
Technical outlook for the Shanghai market
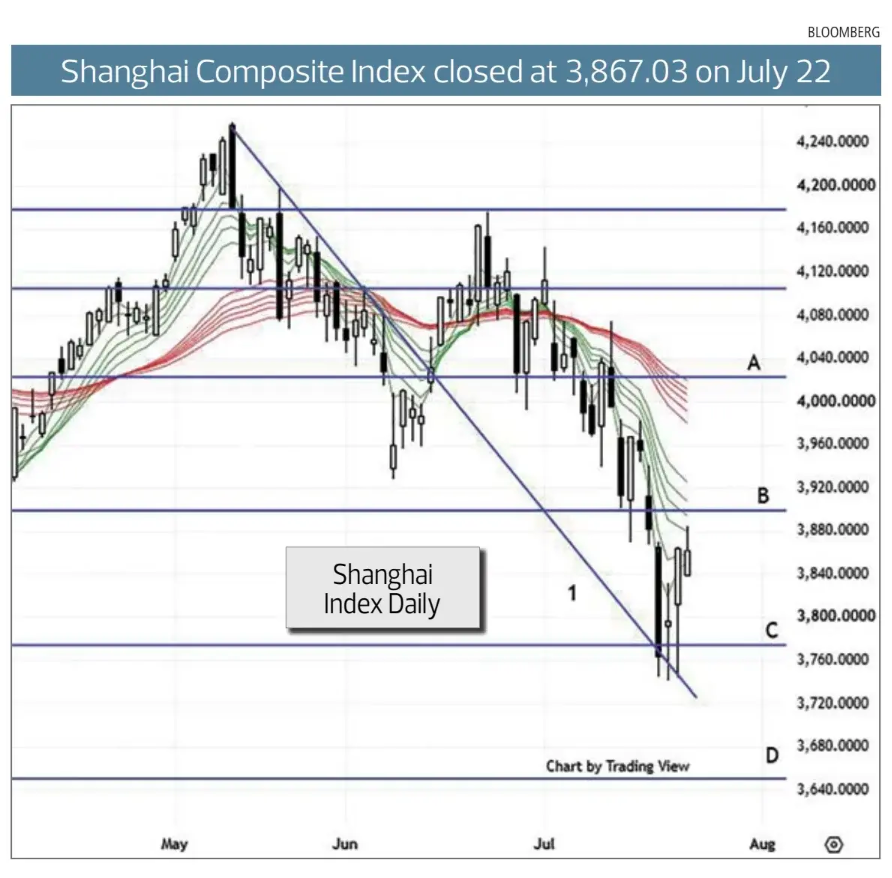
The rapid fall last week carried the Shanghai Index below support near 3,900 and tested support near 3,780. The rebound from this level — shown as line C — has been a rapid move towards 3,900, which is now acting as a resistance level.
This is a strong rebound, but it must be treated as a rally within the context of a downtrend. A sustained move above resistance near 3,890 — shown as line B — is required before we can call a new uptrend.
A retreat and fall below 3,780 has support near 3,650, shown as line D.
The downtrend line 1, projected from its start on May 15, has also provided a support point for the most recent market retreat. The combined support features of the trend line and line C support near 3,780 suggest there is a higher probability that the market rally can continue and move above resistance near 3,890.
However this does not eliminate the potential for a retreat and retest of support near 3,890 prior to another rally.
This bearish outlook is supported by the relationships in the Guppy Multiple Moving Average indicator. The long-term group of averages has turned down and is spreading. This is usually associated with strong investor selling.
The short-term group of averages are well separated, showing strong support from traders for continued sell-offs. Compression shows traders have become buyers.
These relationships suggest that a rally and retreat development is the most probable outcome of the current index activity. There are no RSI divergence signals for a trend change. Traders will look for a retest and consolidation around 3,780 before positioning for a new uptrend.
Daryl Guppy is an international financial technical analysis expert. He has provided weekly Shanghai Index analysis for mainland Chinese media for two decades. Guppy appears regularly on CNBC Asia and is known as “The Chart Man”. He is a former national board member of the Australia-China Business Council. He owns Chinese stock and index ETFs.
Key Words: China, New Economy, Measuring




























































































 京公网安备 11010802037854号


