LATEST INSIGHTS
Your Present Location: LATEST INSIGHTSCan gold and silver deliver another outstanding year in returns?
Can gold and silver deliver another outstanding year in returns?
Investors who missed out want to know if the rising trend in these precious metals can continue, or if it is too late to join the party
Source: Business Times
Update: Jan 6th, 2026, 5:05 PM
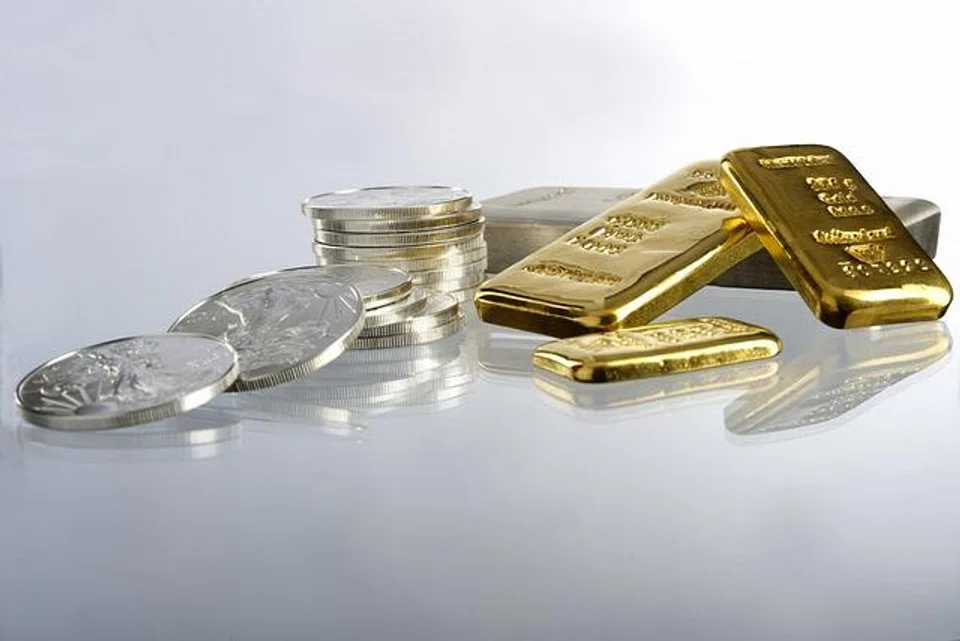
A bullish outlook still holds for gold, but caution is warranted for silver. PHOTO: PIXABAY
THERE is a song, first recorded in the 1950s, which laments: “Silver threads and golden needles cannot mend this heart of mine.” This line is indeed appropriate for investors who did not have gold or silver in their portfolios in 2025.
Gold returned 64.6 per cent in 2025, and silver, seen as the poor relation to gold, did even better – an outstanding 149.6 per cent return.
Although gold captures the modern imagination, it is silver that has ruled supreme for centuries as a store of value. In OG stores, a sign in Chinese at the cashier desk translates to “pay silver here”. The Chinese for bank – yin hang – is all about silver.
Silver was the primary means of currency exchange for centuries before gold shouldered its way in. Now, silver is an essential industrial metal used in the green economy of electric vehicles and solar panels.
Demand has increased dramatically. Shortages, most recently exacerbated by Chinese restrictions on silver exports, have caused the silver price to surge in 2025. China controls around 60 per cent of silver refining, not the supply of silver.
The question for investors in 2026 is whether silver and gold can deliver another outstanding yearly portfolio performance for those who already hold these commodities.
For those who missed out, the question is slightly different. They want to know if the rising trend in gold and silver can continue, or if it is too late to join the party.
Caution on silver
We start with silver and the weekly chart signals caution. Silver moved in a parabolic trend when the extended rally commenced in May 2025. The term is a misnomer, as the curved trend line on the chart is not a parabolic line.
But this was how it was first described and the label has stuck. In fact, the curve is a segment of an ellipse and it defines fast-moving trends.
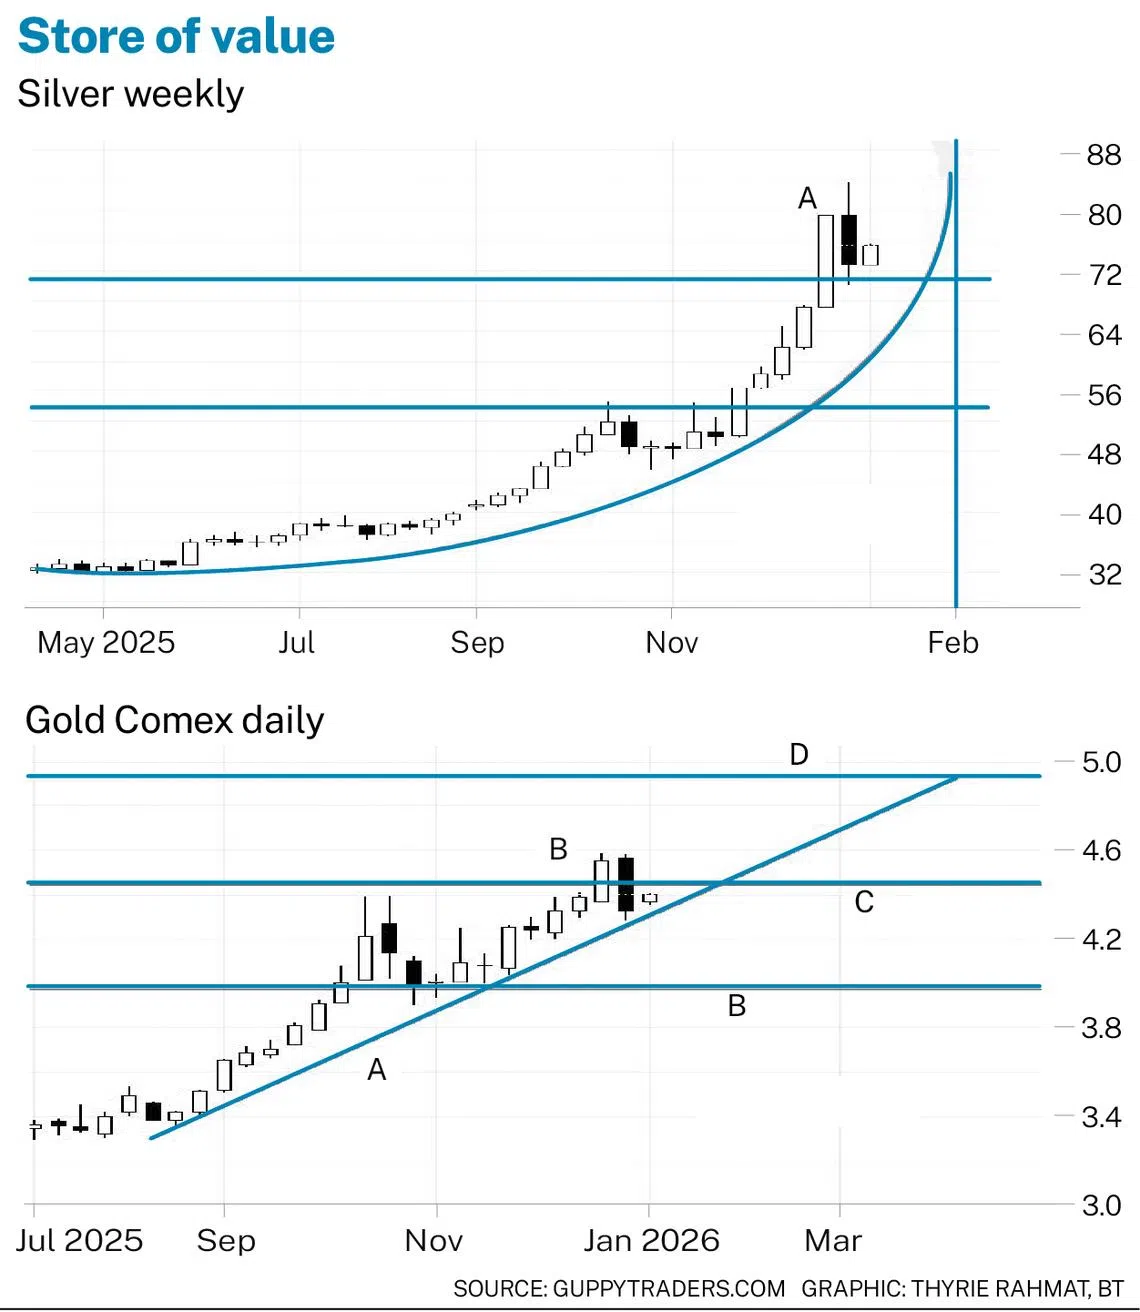
It also has a unique defining characteristic that identifies the timing of the end of the trend. A vertical line is plotted when the ellipse segment begins to turn back on itself. This vertical line sets the date when the price inevitably must cross the curved trend line.
It must cross because the position of the curved line does not change, and each week the next candle moves inexorably towards the curved line.
When the parabolic trend line is crossed, there is a high probability of a substantial collapse in prices. This is often up to a 50 per cent retracement.
Smart traders exit these trends as close to the inevitable crossover point as possible. The parabolic trend line suggests there is a high probability of trend collapse in early February.
Note that this analysis tool does not indicate how high prices may climb before reaching the vertical line. Four weekly moves of US$10 would lift the price to over US$100 before it must cross the trend line.
Of course, prices may collapse before the inevitable point of crossover.
Gold’s trend strength
The gold chart has a more optimistic outlook. There are two defining features. The first feature is trend line A. This defines the trend and acts as a support feature. When gold pulls back, it uses this trend line as a rebound point.
The targets for the gold price are defined using trading band analysis. The width of the trading band between support at line B and resistance at line C is measured. This value is projected upwards to line D, and gives a target value near US$4,935.
The trading bands shown are projections of previous trading bands, which are not shown on this chart.
The trading band lines and their projections provide the targets for the gold price. The trend line helps define how the price will reach these targets.
A breakout above trading band line C has an upside target at line D. A fall below the value of the trend line has a downside target near trading band line B.
The bullish outlook for gold is confirmed with the Guppy Multiple Moving Average (GMMA) indicator relationships. For clarity, these are not shown on the chart.
However, the long-term GMMA is widely separated, showing good support from investors. The separation between the short and long-term groups of averages remains steady, again showing strong support for trend continuation.
The silver chart suggests the silver thread may snap, and this offers a re-entry opportunity at a lower price. The gold chart shows continued trend strength, offering good entry opportunities when the price touches the trend line.
The writer is a financial technical analysis specialist, equity and derivatives trader, as well as author
Key Words: Gold, Silver, Invest,


 京公网安备 11010802037854号


